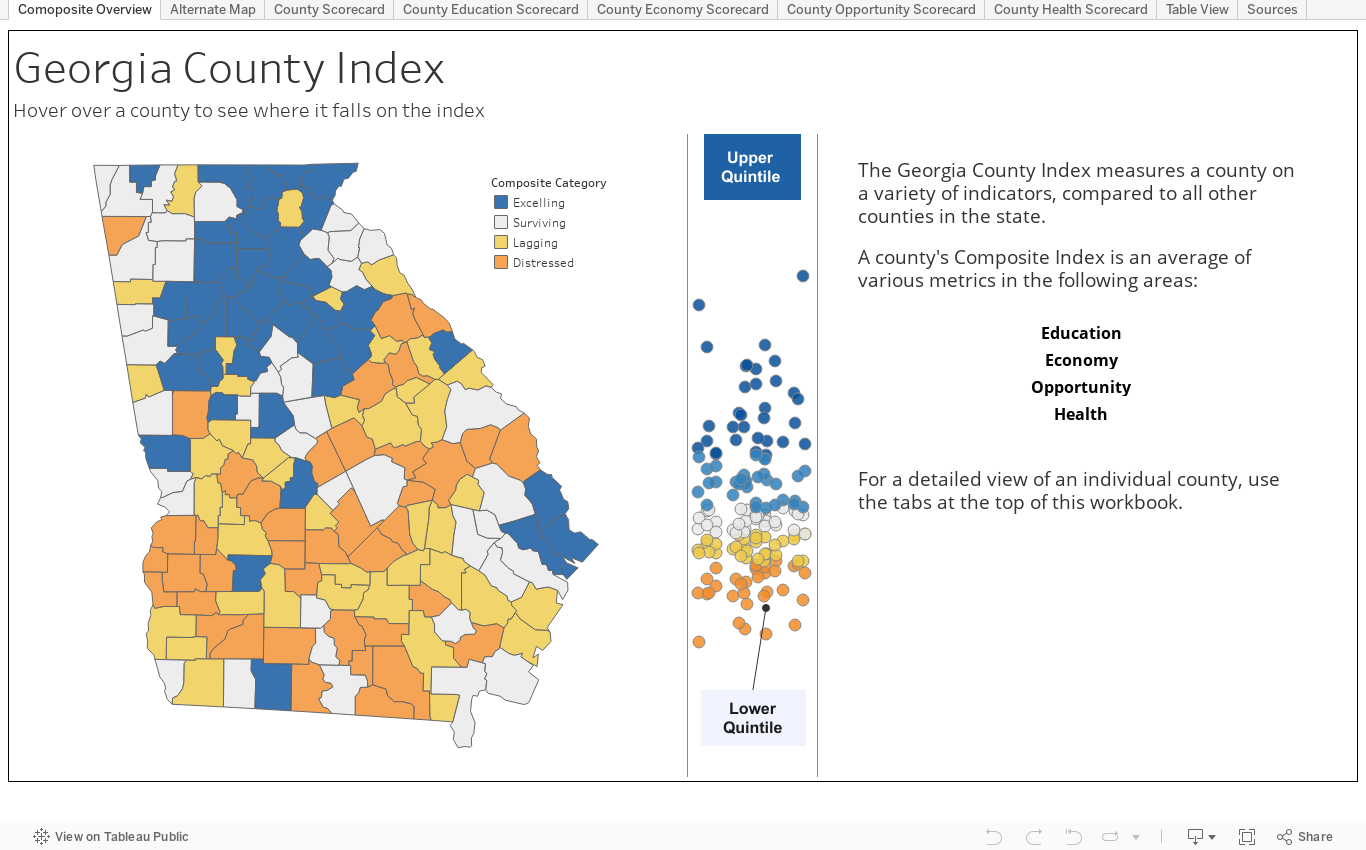
All of our communities have strengths and areas of growth. Many of us know these strengths and weaknesses off the top of our head, or have strong research or analytical teams to stay up to date on the information. But the seemingly endless list of data points can make the process of sorting out community strengths from weaknesses overwhelming. If a community wants to devote a attention to strengthening its education system, for example, this can immediately become a dauntign task. What part of our ducation system? Elementary schools? Colleges? Adult learners? And what metrics do we even use to evaluate the various components for our county's education system to begin with?
These sorts of problems are why indexes are so popular. Instead of having to analyze hundreds of data points, only the select few known to signal impact in an area are used, and then combined into a single scale for a simplified communication and easier understanding. Of course, this begs the question: why another index? In the Georgia Academy for Economic Development, we're uniquely focused on Georgia's communities. So instead of using an index out there designed to evaluate every county across the nation, we developed a way that focuses exclusively on Georgia's counties, the issues that matter specifically to them, and in turn made it possible to assess a county's health in context of only Georgia's other counties.
In order to this, we collected 13 data points from reliable sources at the county level, and combined them into 4 categories: Economy, Education, Health, and Opportunity. Those data points are then normalized across all 159 counties, and aggregated into a score for each category. In turn, each of those category's scores are then combined for an overall, Composite Score.
Economy30% |
Education30% |
Health20% |
Opportunity20% |
|---|---|---|---|
|
|
|
|
Based on the categories and data points, how well do you think your county is performing within these areas? use the tool below to select your county, and assign it a score in each category. After completing the form, you'll see how your assessment compares to the actual results.
How does your county perform in the following areas?
Move the sliders on a scale of 0 to 100, with 0 being the worst, and 100 being the best
First, select a county
Your Assessment
81
You overestimated your county's performance. Use the tool below to explore the data
Actual Performance
81
← Struggling
High Performing →
To explore the data in greater detail, use the tools below. There is a simple table with all county scores, as well as an exploratory tool for more advanced analysis of the indicators and their underlying metrics.